
ATCA observations of
GRB990510
These results have been obtained as part of project C651 by D.A. Frail,
S.R. Kulkarni, the ATCA Alert group and the BeppoSAX GRB team.
Permission to quote results should be obtained from Dale Frail
(dfrail@aoc.nrao.edu).
Observations on 99:05:10 - Day 0
-
The observations ran from 1999MAY10:22:36 UT to 1999MAY11:05:53 UT
(May 11.09) at 4.8 and 8.6 GHz. The data was of good quality with no
significant interference,
reaching the thermal noise for both frequencies. However, due to low
source elevation and cloudy weather, the phase calibration was not
optimal. Especially around the middle of the observation
some decorrelation may have occurred. The calibration cycle was
shortened to 7m on source, 1 m on cal to track the phase more
accurately from 2UT. Total on source integration time was 4.4 hours.
-
The fieldcenter (RA 13:38:08, DEC -80:29:18, J2000) was shifted from
the optical transient position (RA 13:38:07.62, DEC -80:29:48.8, J2000)
to avoid DC offsets.
-
8.6 GHz: rms=70 uJy, peak in 4" box around optical position 190 uJy,
peak in 12" box 210 uJy.
-
4.8 GHz: rms=75 uJy, peak in 4" box around optical position 190 uJy,
peak in 12" box 210 uJy.
- No convincing detections above the 3 sigma noise level of 210uJy
inside the boxes around the transient.
- Images:
3cm overview
(postscript),
3cm detail
(postscript).
The green circle is the fieldcenter, the yellow circle
is the optical position with 2" uncertainty, and the blue circle is
the BeppoSAX position.
8.7 GHz image of GRB (left) and source
2 (right), yellow circle marks 2 sigma error in optical position.
Observations on 99:05:13 - Day 3
-
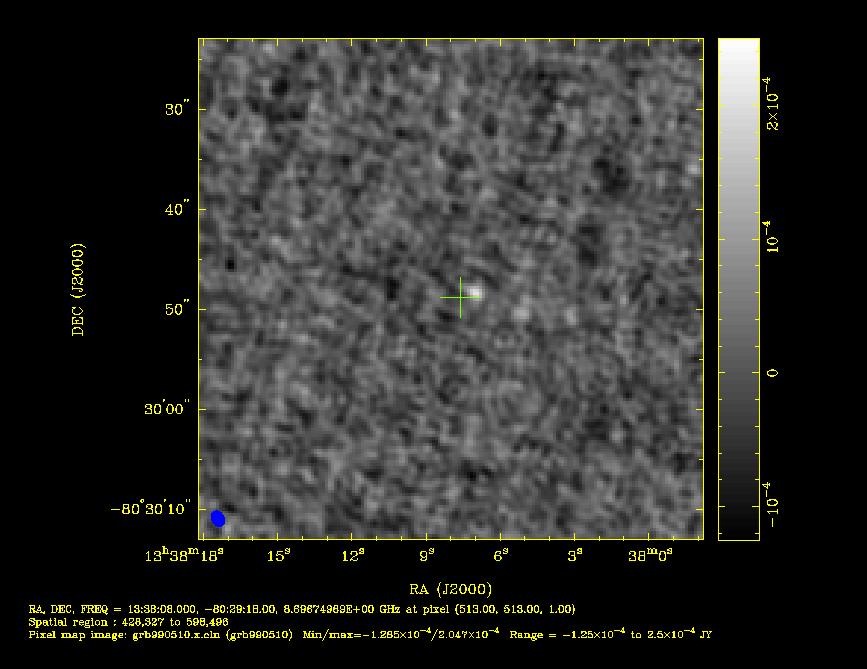
We obtained a 9 hour integration centered on May 13.68 at 8.7 GHz.
In a 200 x 200 arcsec region around the optical
transient position we detect 2 sources above 5 sigma, one of which
lies 1.5" from the OT. We claim detection of a radio
counterpart at RA 13:38:07.08, DEC -80:29:48.4 (+/- 0.3")
with a fluxdensity of 227+/-30 microJy (at t=3.31 d since burst).
- The corresponding position in the Day 0 data gives a fluxdensity
of 86+/-69 microJy, or a 2 sigma upper limit of 224 microJy at 8.6 GHz
on May 11.09 (t=0.72 days since burst).
- Image:
8.7 GHz image of GRB (left) and source
2 (right), yellow circle marks 2 sigma error in optical position.
Observations on 99:05:15 - Day 5
-
We obtained an 8 hour integration centered on May 15.61 at 8.7 GHz.
The radio counterpart was detected,
with a fluxdensity of 202+/-31 microJy (at t=5.24 d since burst). The
best fit position (including previous observations) is RA 13:38:07.03,
DEC -80:29:48.3 (+/- 0.2") (J2000).
- Images:
3cm detection with Optical Transient position
(postscript),
8.7 GHz image of GRB (left) and source
2 (right), yellow circle marks 2 sigma error in optical position
Observations on 99:05:17 - Day 7
-
We obtained a 6.6 hour integration centered on May 17.58 at 8.7 GHz.
The radio counterpart was only barely detected,
with a fluxdensity of 138+/-32 microJy (at t=7.21 d since burst).
- Image:
8.7 GHz image of GRB (left) and source
2 (right), yellow circle marks 2 sigma error in optical position.
Observations on 99:05:19 - Day 9
-
We obtained an 11.4 hour integration centered on May 19.59 at 4.8
and 8.6 GHz.
The radio counterpart was detected at 8.6 GHz with at fluxdensity of
127 +/- 34 microJy and
possibly detected at 4.8 GHz with a fitted fluxdensity of 134 +/- 34
microJy (at position of 3 cm source), at t=9.22 d since burst.
- Image:
8.7 GHz image of GRB (left) and source
2 (right), yellow circle marks 2 sigma error in optical position.
Observations on 99:05:25 - Day 14
-
We obtained a 10.6 hour integration centered on May 25.32 at 8.7 GHz.
A fit at the position of the radio counterpart gives a fluxdensity of
82 +/- 28 microJy at t=14.95 d since burst.
- Image:
8.7 GHz image of GRB (left) and source
2 (right), yellow circle marks 2 sigma error in optical position.
Observations on 99:05:27 - Day 17
-
We obtained a 10.9 hour integration centered on May 27.38 at 8.7 GHz.
A fit at the position of the radio counterpart gives a fluxdensity of
52 +/- 31 microJy at t=17.01 d since burst.
- Image:
8.7 GHz image of GRB (left) and source
2 (right), yellow circle marks 2 sigma error in optical position.
Observations on 99:05:29 - Day 19
-
We obtained a 9.6 hour integration centered on May 29.94 at 8.7 GHz.
A fit at the position of the radio counterpart gives a fluxdensity of
71 +/- 32 microJy at t=19.58 d since burst.
- Image:
8.7 GHz image of GRB (left) and source
2 (right), yellow circle marks 2 sigma error in optical position.
Observations on 99:06:26 - Day 46
-
We obtained a 11.7 hour integration centered on June 26.18 at 8.7
GHz. (The observation consisted of 3 blocks: 99JUN25:09:14-12:58,
99JUN25:20:17-99JUN26:00:56 and 99JUN26:15:31-21:54 in the 375m array).
A fit at the position of the radio counterpart gives a fluxdensity of
1 +/- 28 microJy at t=46.81 d since burst, so the source is no longer
visible.
- Image:
8.7 GHz image of GRB (left) and source
2 (right), yellow circle marks 2 sigma error in optical position.
Lightcurve
The 3cm field contains two sources, the GRB counterpart at 13:38:07.07,
-80:29:48.28 (J2000), which is within the errorbars of the optical
transient position (RA = 13:38:07.11, Dec = -80:29:48.2 (J2000) with an
uncertainty of +- 0.44", Jens Hjorth GCN 320); and a
second source at 13:37:56.79, -80:29:52.85. The second source appears
to be variable from day to day as well.
Table of Observations
Date in May
(UT) |
t
days |
Freq
GHz |
Fluxdensity
(uJy) |
Noise level
(uJy) |
Source 2
(uJy) |
Integration
(h) |
Resolution
(arcsec) |
Bandwidth
(MHz) |
| 11.09 |
0.72 |
8.6 |
86 | 69 | 89 |
7.5 |
2.4x1.1 |
100 |
| 13.68 |
3.31 |
8.7 |
227 | 30 | 253 |
9.0 |
1.8x1.3 |
200 |
| 15.61 |
5.24 |
8.7 |
202 | 31 | 169 |
8.0 |
1.7x1.3 |
200 |
| 17.58 |
7.21 |
8.7 |
138 | 32 | 92 |
6.6 |
2.1x1.2 |
200 |
| 19.59 |
9.22 |
8.6 |
127 | 34 | 153 |
11.4 |
1.9x1.4 |
100 |
| 25.32 |
14.95 |
8.7 |
82 | 28 | 133 |
10.6 |
2.2x1.2 |
200 |
| 27.38 |
17.01 |
8.7 |
52 | 31 | 108 |
10.9 |
1.9x1.3 |
200 |
| 29.94 |
19.58 |
8.7 |
71 | 32 | 194 |
9.6 |
1.7x1.4 |
200 |
| 57.18 |
46.81 |
8.7 |
-1 | 28 | 142 |
11.7 |
4.0x3.6 |
200 |
| 11.09 |
0.72 |
4.8 |
180 | 69 | 110 |
7.5 |
4.3x1.8 |
100 |
| 19.59 |
9.22 |
4.8 |
134 | 33 | 177 |
11.4 |
3.3x2.5 |
100 |
Last changed on: 28-Jun-1999
Mark.Wieringa@atnf.csiro.au