How to make a noise and an emission map
In order to verify your data taking is progessing smoothly, you want to check your data immediately after you have taken the first few maps. For that reason, we provide you with the necessary steps and a script to reduce your data.
First, download the MAKEMAP.PRO IDL script. The instructions found below are also inside that script file.
In order for this to run successfully, you need to have the following software installed on your computer:
- Livedata
- Gridzilla
- kvis
- miriad
- IDL
- Astro libraries. Click here to download astron.dir.zip
- The Coyote graphics libraries for IDL, Click here to download Coyote graphics
- To install the Astro library:
- Create a directory ~/IDL in your machine home (if it doesn't exist already)
- Unpack astron.dir.zip into that directory so there's
~/IDL/astron.dir/...
- Edit the file
~/IDL/idl_startup and add the following two lines (the compile option is not strictly required for astrolib, but it's a good practise to have 32bit integers by default in the 21st century so your integer loop variables won't be +/-16k cyclic....):
- astrolib
- Compile_Opt DEFINT32
First, prepare your data as follows:
- Run livedata. Note that you are limited to do one IF at a time if you do it manually
- In configuration, select MOPRA
- Select Bandpass calibration
- Select Write data
- in "Input Data Selection", select only IF1 (by default IF1 and IF2 are selected)
- set Channel Range to go from 1 to 4096 (if Mopra Zoom or Fastmapping data) or 1 to 8192 (if Mopra Broadband data)
- in Bandpass Calibration, set the Mask to go from 1 to 300 and from 3796 to 4096 (or 7892 to 8192 for Broadband mode). This cuts off the top and bottom 300 channels
- Select all your data files
- Enqueue all files and hit START. This will take a few minutes to complete.
you now should have a *.sdfits file for every *.rpf file you gave it to process
- Run gridzilla on the files created in step 1:
- Select MOPRA from the presets (top right)
- Select the velocity range to the range you are expecting (or leave at default -1000 to +1000)
- Set your line rest frequency. This is where the center of the Z axis in the data cube will be.
- Adjust the Beam FWHM to the size that corresponds to your observing frequency
- Set the output FITS filename. In this example N2H+, or "n2hp" for the filename.
- Press GO. Get a coffee. When you get back, you'll have a file called "n2hp_MEAN.fits" which has the gridded map inside.
- Now you need to create the 0th moment map.
- Start kvis. You first need to locate which channels contain your emission:
- Open the n2hp_MEAN.fits file. Select View -> Profile Mode: Line
- Move the mouse in the map until you find your emission. Now you can use the Movie mode to play through your data. Locate the channel number where your line emission starts and where it ends. In the example below, this was found to be from 2976 to 3123.
- While you're at it, you also want to find an emission free region for your noise map. In the example below, that is from 500 to 2500.
- Now start miriad and create the actual moment map. From the miriad command line, type these commands:
fits in=n2hp_MEAN.fits op=xyin out=IF1
imsub in=IF1 out=n2hp region='images(2976,3123)'
moment in=n2hp out=n2hp.mom0 mom=0
- Now open the n2hp.mom0 map with kvis and save that file as "n2hp_hdr.fits". This file will be needed to read header information that otherwise is difficult to create from scratch and is needed to display your data further down in this IDL script.
- n2hp.mom0 (or the FITS file you just saved) essentially contains your science result. However, to make it look pretty, we now need to run this IDL script.
- Run this IDL script.
- First, change the information below where it says YOUR INPUT GOES HERE.
- compile and run the noise map (set noise_plot = 1)
- compile and run the emission map (set noise_plot = 0)
- Experiment with fit_baseline! Your maps often can be made much smoother by fitting a baseline along the Z (spectral) axis!
- read through the source so you understand what happens where and why! Use this as a template to extend and build your own!
- I have tried to comment all that I think needs explaining. If you have problems or praise, feel free to contact me at the email above.
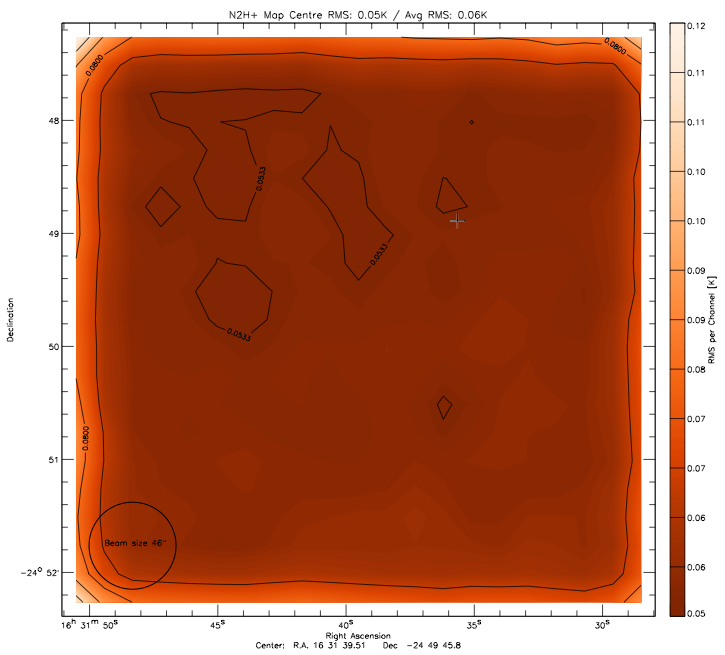
Once these steps have been completed, you too can boast a pretty noise map like this:
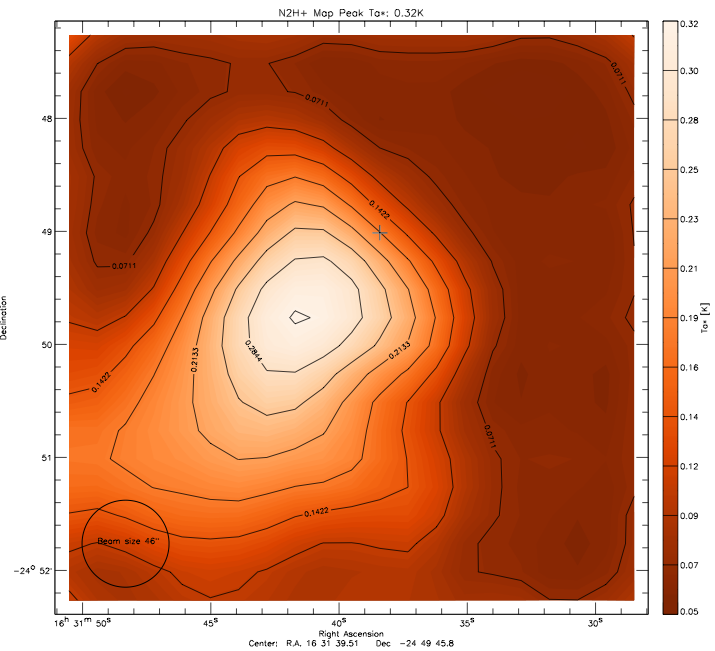
and an emission map like this:
Created: Balt Indermuehle (02 JUL 2011)
Modified: Balt Indermuehle (25 AUG 2011)