This loads a font easier to read for people with dyslexia.
This renders the document in high contrast mode.
This renders the document as white on black
This can help those with trouble processing rapid screen movements.

H.2. Shadowing Diagrams

The diagrams in this section can allow you to quickly determine how long you can observe a source with a particular array before you have problems with shadowing.

These diagrams are to read as follows.

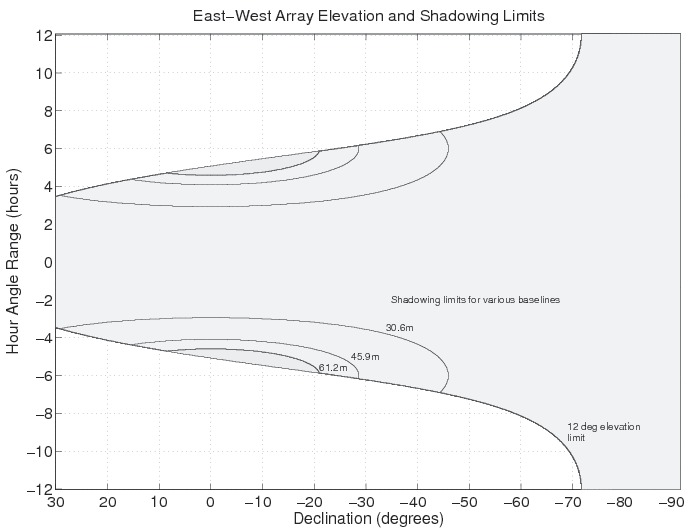
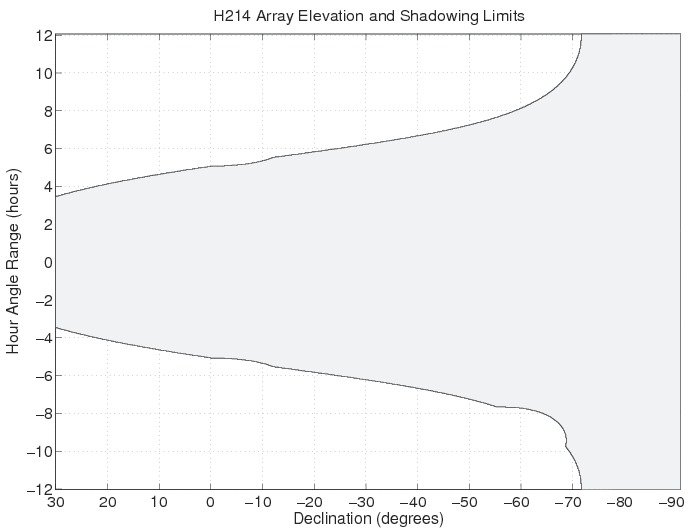
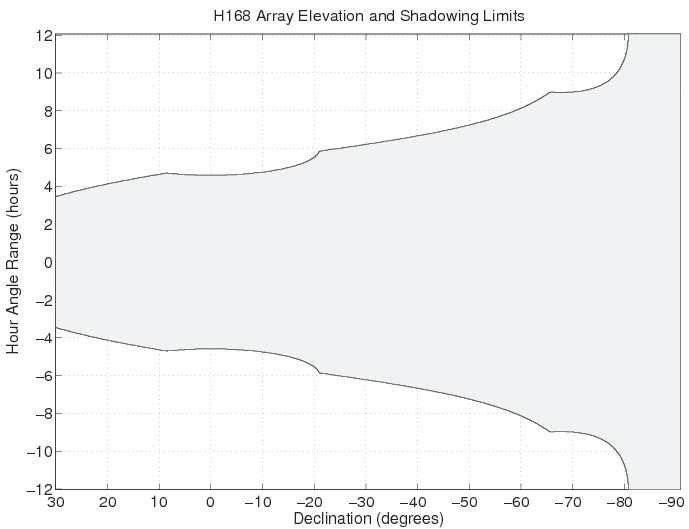
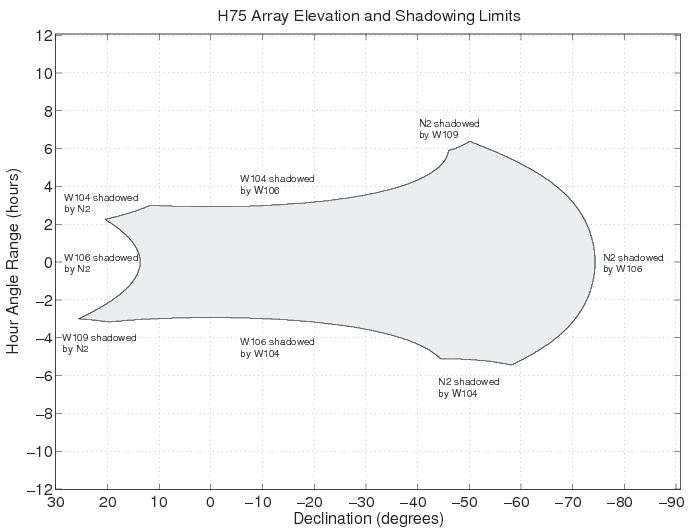
  • The grey area on each plot is where the source is above the 12° elevation limit and there is no shadowing on any antenna.

  • For any source at a particular declination, you can determine the hour angle at which the source sets, or an antenna becomes shadowed, by reading off the hour angle at the edge of the grey area. The hour angle for the elevation limit or shadowing is symmetrical around zero.

  • Each of the hybrid arrays has its own shadowing diagram, but you can use the first diagram for any east-west array with baselines shorter than 61.2 m.

East-West Elevation and Shadowing Limits for the ATCA.

Figure H.1. East-West Elevation and Shadowing Limits for the ATCA.


H214 Array Elevation and Shadowing Limits for the ATCA.

Figure H.2. H214 Array Elevation and Shadowing Limits for the ATCA.


H168 Array Elevation and Shadowing Limits for the ATCA.

Figure H.3. H168 Array Elevation and Shadowing Limits for the ATCA.


H75 Array Elevation and Shadowing Limits for the ATCA.

Figure H.4. H75 Array Elevation and Shadowing Limits for the ATCA.