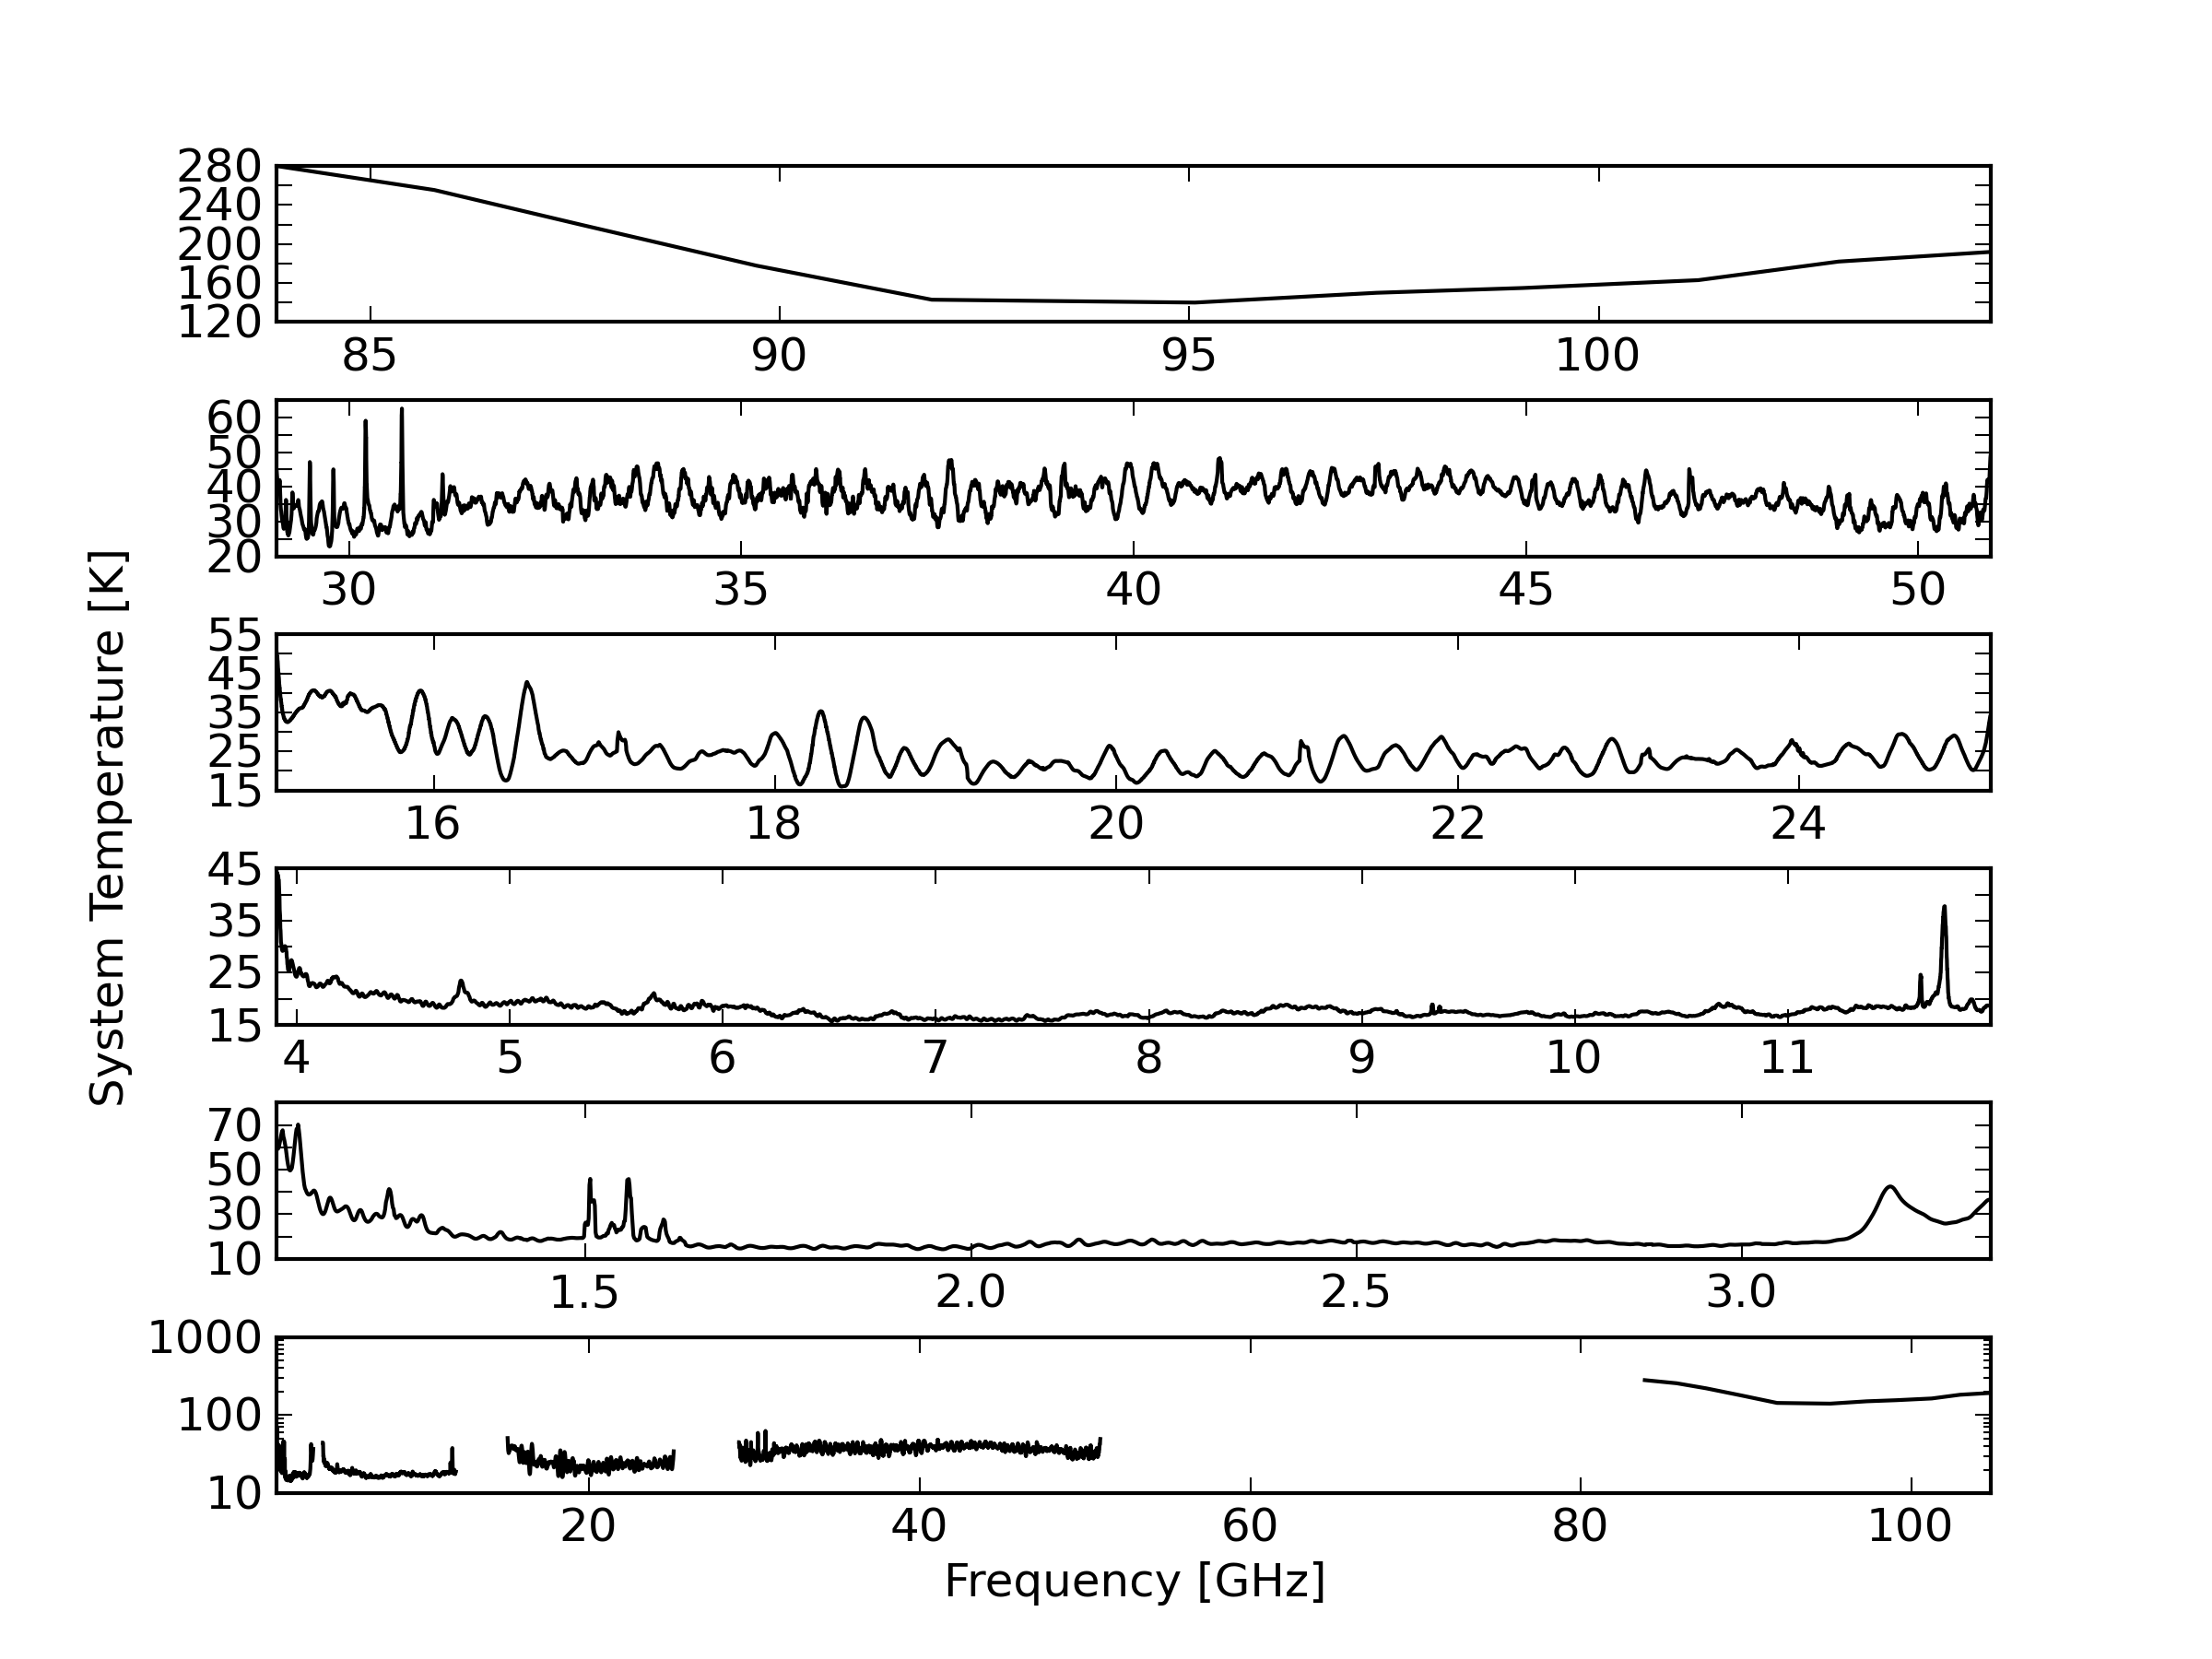
Figure 1.3. Average Compact Array system temperatures for each observing band at high elevation under reasonable observing conditions. These are based on hot-cold load measurements, and include the atmosphere at the time of observation, thus representing the total system temperature. These measurements were made by J. Stevens with the CABB system, except for the 3mm measurements which were made by T. Wong in September 2004.
You can also switch automatically to other wavelengths within tens of seconds (with the exception of the 7mm band as described previously). Similarly the 16cm receiver has a single feedhorn and observations with this package will cover the entire 1.1 - 3.1 GHz range simultaneously. Observations at two simultaneous frequencies are possible in the 4cm, 15mm, 7mm, or the 3mm bands. With CABB, the centre frequencies of the two IFs need to lie within 6 GHz of each other, and even this might be too much separation depending on the exact frequencies chosen. For CABB, the nominal standard frequencies for continuum observations are
2100 MHz in the 16cm band,
5500 MHz and 9000 MHz in the 4cm band,
16700 MHz and 21200 MHz in the 15mm band,
33000 MHz and 35000 MHz in the 7mm LSB band,
43000 MHz and 45000 MHz in the 7mm USB band,
93000 MHz and 95000 MHz in the 3mm band.
These frequency designations follow the ATCA custom of stating the central frequency of the chosen observing frequency range. (For archival data from the pre-CABB era the standard frequencies were
1384 MHz and 2368 MHz in the 20/13cm band,
4800 MHz and 8640 MHz in the 6/3cm band,
18496 MHz and 19520 MHz in the 12mm band,
34496 MHz and 34524 MHz in the 7mm LSB band,
44096 MHz and 44224 MHz in the 7mm USB band,
93504 MHz and 95552 MHz in the 3mm band.
The 15mm recommended CABB central frequencies have recently been changed from 17000 and 19000 GHz, due to the presence of RFI from a geostationary satellite (see Section 1.3.2.3 for details).
Switching between the different frequency bands involves a changing the feed horns. The different feed horns are mounted on a "turret" which rotates the appropriate feed horn to the on-axis position. This is done automatically under computer control and takes about 20 seconds. Turret rotation should be limited to once every 15 minutes unless a compelling scientific case is made for more frequent rotations. The additional overhead in changing to or from 7mm has been described earlier in this document.
Observing-band centre frequencies may be set to the nearest MHz only and no on-line Doppler tracking is done.
Observations of weak H 90α recombination lines may be affected by a trapped mode in the 6/3cm horn at 8857 ± 18 MHz. This trapped mode may enhance the power received this recombination line at their rest-frequency. There are also notches reported in the passband due to trapped modes in the receiver waveguides at 4550 ± 10 MHz, 5328 ± 10 MHz and 8780 ± 10 MHz which may need to be flagged during data reduction.
Both terrestrial and satellite emitters cause radio frequency interference (RFI) to ATCA observations, with the lower frequency bands being more adversely affected than the higher frequency bands. This section describes the RFI that is known in each of the ATCA bands, and also covers interference caused by the Sun.
The interference is worse at lower frequencies with the main offenders being microwave links, microwave TV, microwave ovens, navigation satellites and self-generated interference. There can also be significant interference at 1381 MHz from the GPS L3 beacon on occasions. These channels may have to be removed from the data. Figure 1.4 shows what the ATCA sees in its 16cm band (centred at the recommended continuum central frequency of 2100 MHz) when fringe-rotation is disabled (achieved by setting the phase centre to be the South celestial pole). The black, red and blue lines show the log of the amplitude as observed by surveys in 2011, 2015 and 2018 respectively, and from this we can see that the RFI environment does change slightly over time. No self-generated interference is visible in this plot. The Australian Communications and Media Authority (ACMA) band licenses are shown on the plot as coloured frequency regions. The strongest sources of RFI are mobile phone towers, satellites and TV transmitters, all of which are relatively stable in time.
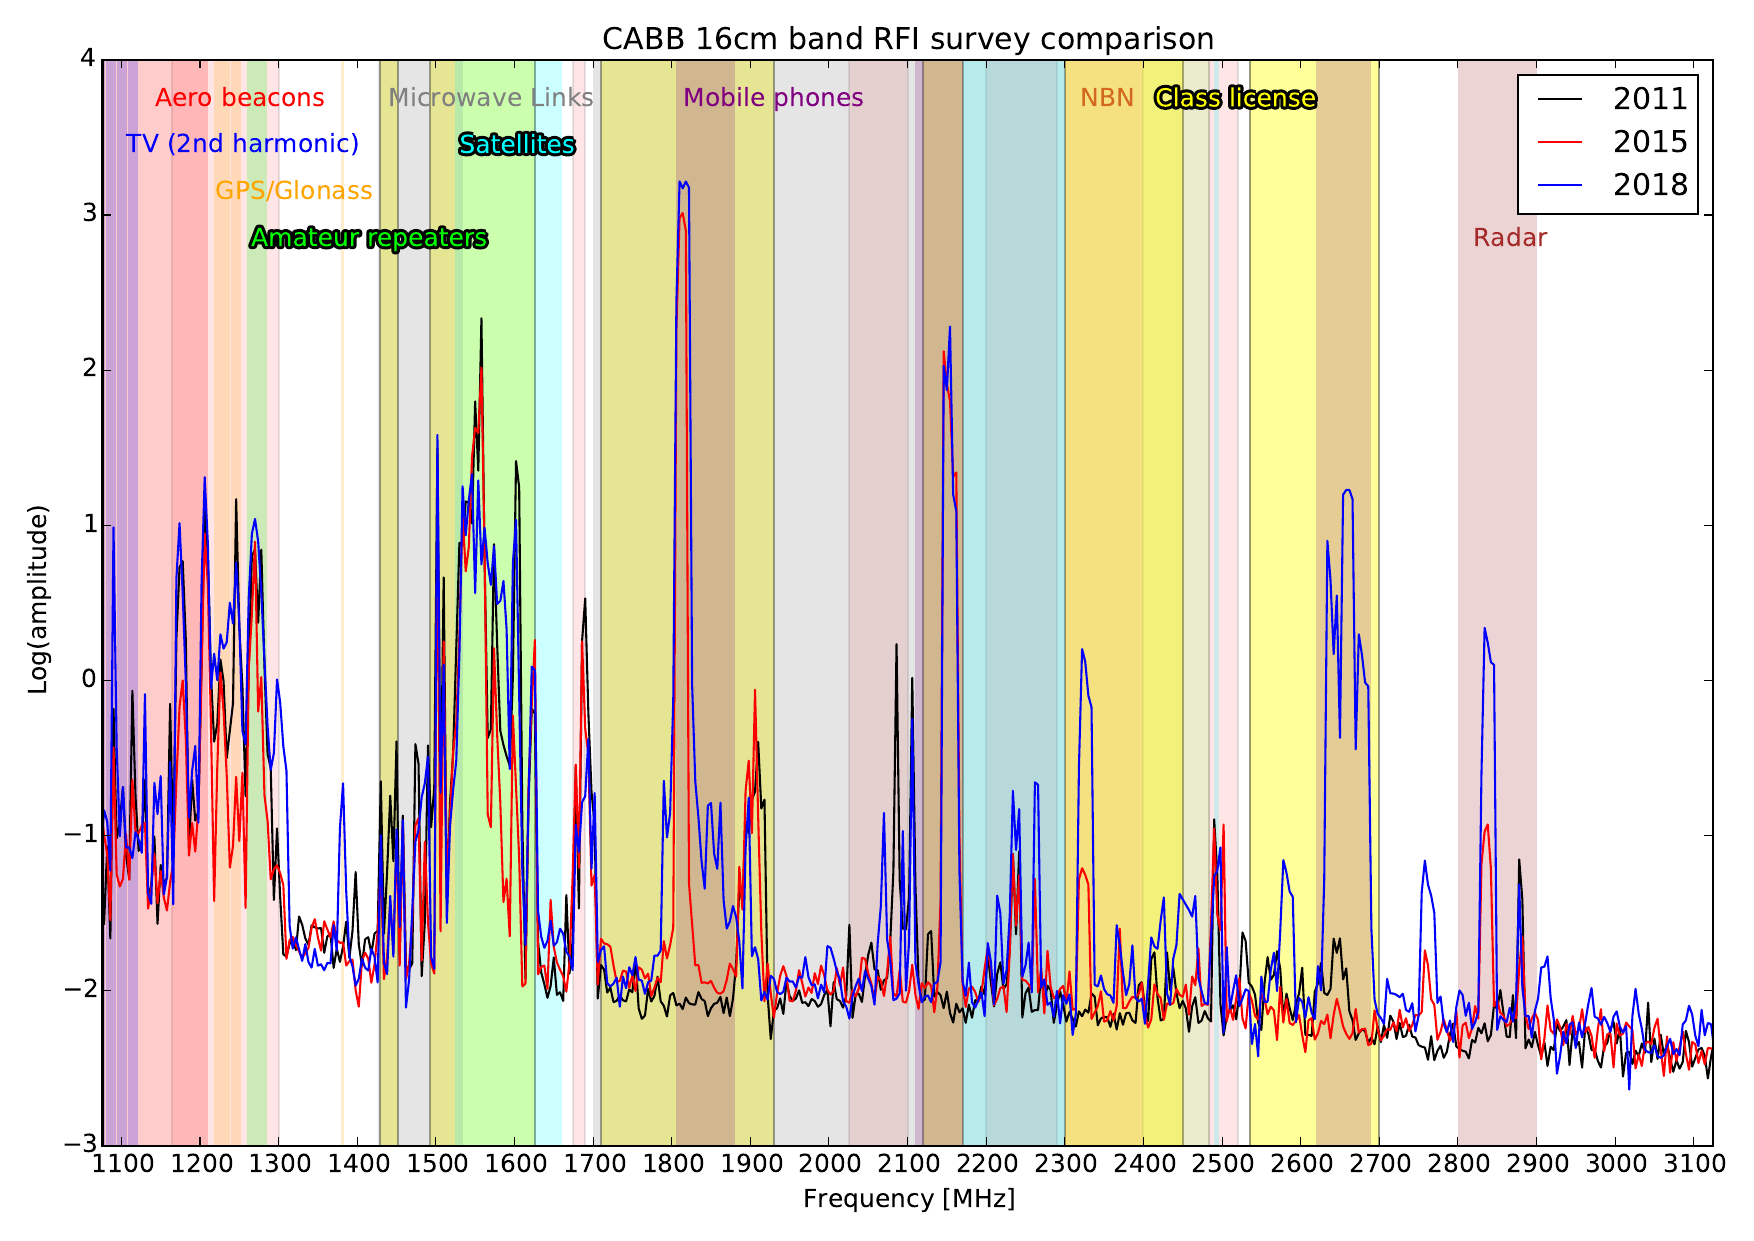
Figure 1.4. The ATCA 16cm RFI environment. Three surveys are shown, one from 2011, one from 2015 and another from 2018. The licenses applicable to each frequency range are shown as coloured regions, labelled with a similar colour at the top of the plot.
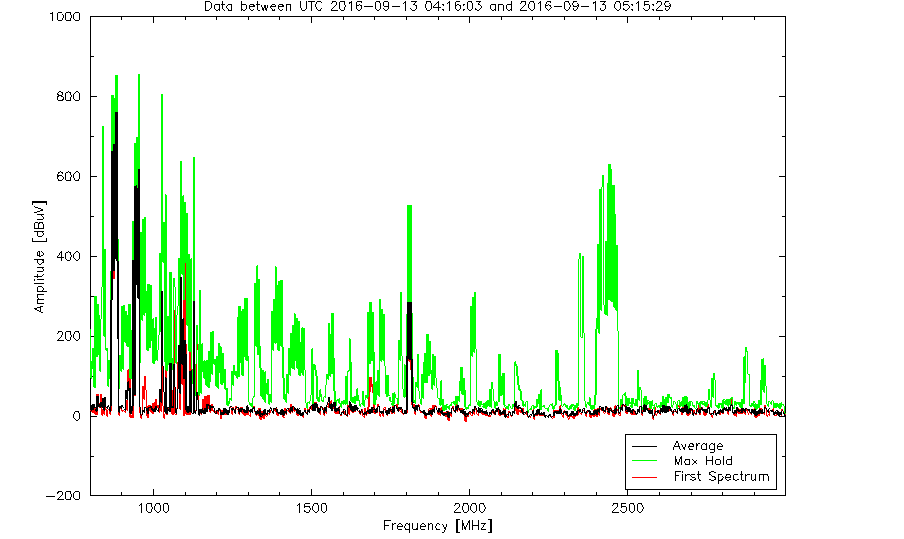
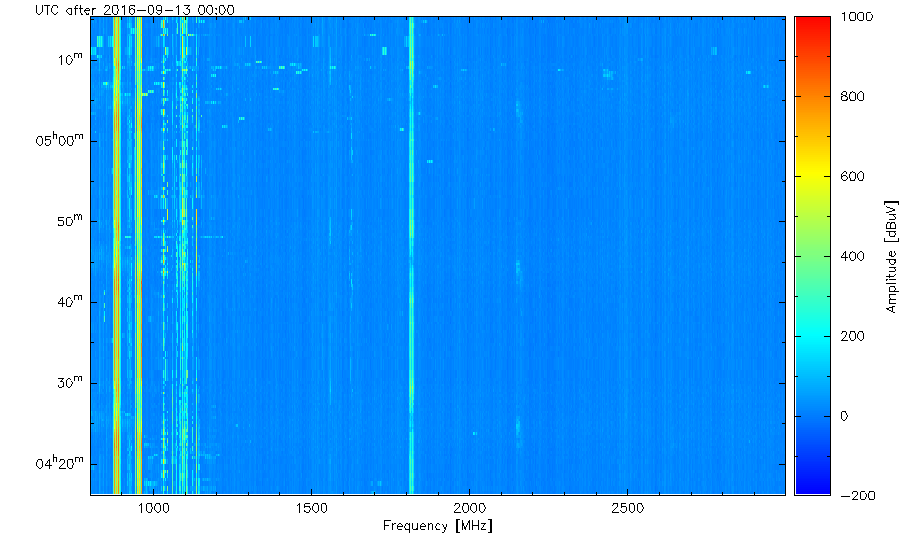
An RFI monitoring antenna sits atop the central control building at the observatory. It monitors the frequency range 700 - 3000 MHz once every 20 seconds, with 2 MHz frequency resolution, and presents its data in near-real time on a web page. Three different plots are presented on the page: a “latest spectra” plot (Figure 1.5), a waterfall plot showing the last hour of data (Figure 1.6), and a plot that may help in determining the direction from which RFI is being observed (Figure 1.7). The latest spectra plot always shows the earliest spectrum obtained by the monitor in the displayed time range, along with a “maximum hold” value for each channel over the last hour and the time-averaged power for each channel. The waterfall plot is useful for seeing emission switch on or off over the last hour. You can also scroll back in time for the past day in half-hour increments for each of the plots.
All data from the RFI monitor is archived. A page showing the RFI waterfalls from ATCA
and Parkes each day from 6am to 8pm (local time) is available at
this link.
If you want to get the output of the monitor for any particular time range since
its installation in November 2014, please contact <Jamie.Stevens@csiro.au>.
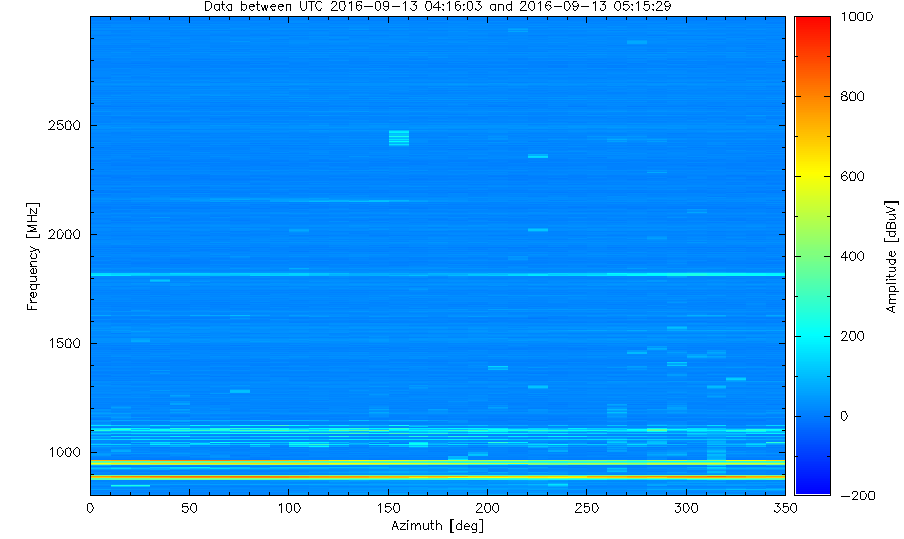
In addition to the “normal” RFI in the 16cm band, as shown in Figure 1.4, you may also see something dubbed “mid-week RFI”. This RFI has frequency peaks around 1265 and 1300-1310 MHz, and can have extremely high amplitudes. The RFI monitor can be used to see when mid-week RFI is present, as shown in Figure 1.8. Because of the strength of this RFI, it can often drive the front-end system of the 16cm receivers, or the CABB digitisers, into saturation, or at least produce very large intermodulation products since each tone will act as another LO; if this occurs, the data becomes unusable. We do now sometimes receive advanced warning on when this RFI may be present, and if this will affect observations, the investigators will be notified so they can plan how to deal with it.
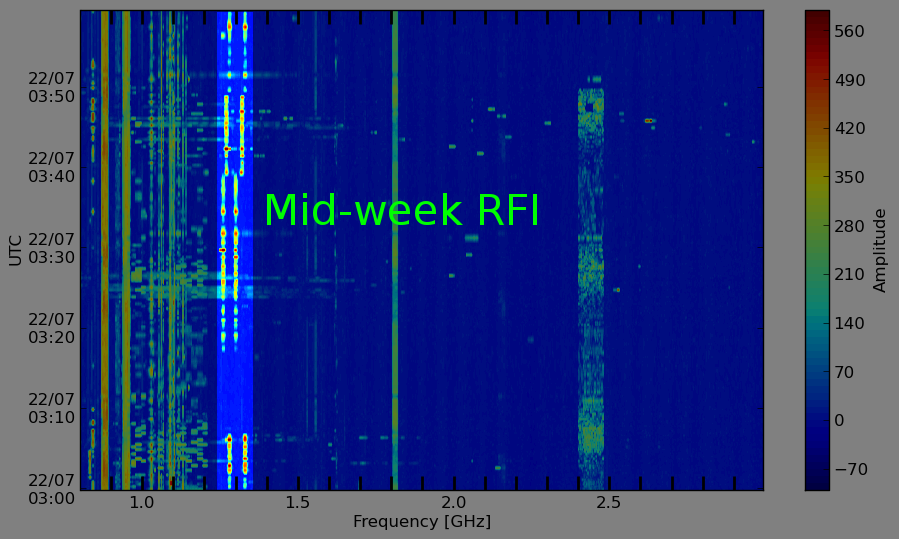
Figure 1.8. A waterfall plot from the RFI monitor, showing what “mid-week RFI” can look like (in the brighter region).
Only the 16cm band is affected by mid-week RFI, so if mid-week RFI is forecast during your observations, you may wish to avoid using the 16cm band during those times, wherever possible. If this is not possible, you may ask for a schedule swap, but this may not always be a possibility. Our observations have also shown that mid-week RFI is present only for a small fraction of the default CABB 10 second cycle time, but is so strong that it ruins the entire integration. You may therefore be able to cope with mid-week RFI by running with a shorter cycle time (say 1 or 2 seconds) and flagging those cycles in which the RFI is present; this will result in a much higher data rate of course, and is only really suitable for continuum experiments that do not need mosaicking.
The RFI present in the 4cm band is direction dependent, and can be quite variable over time. Using a similar survey technique to the 16cm band, where the fringe-rotation is disabled, we can determine the static levels of RFI. We also use the antennas to determine how directional the RFI signals are, by doing the survey twice; once while the antennas are pointing at the South Celestial Pole (SCP, Figure 1.9), and again while pointing at the celestial equator (Figure 1.10). We expect that signals coming from satellites will be stronger towards the celestial equator.
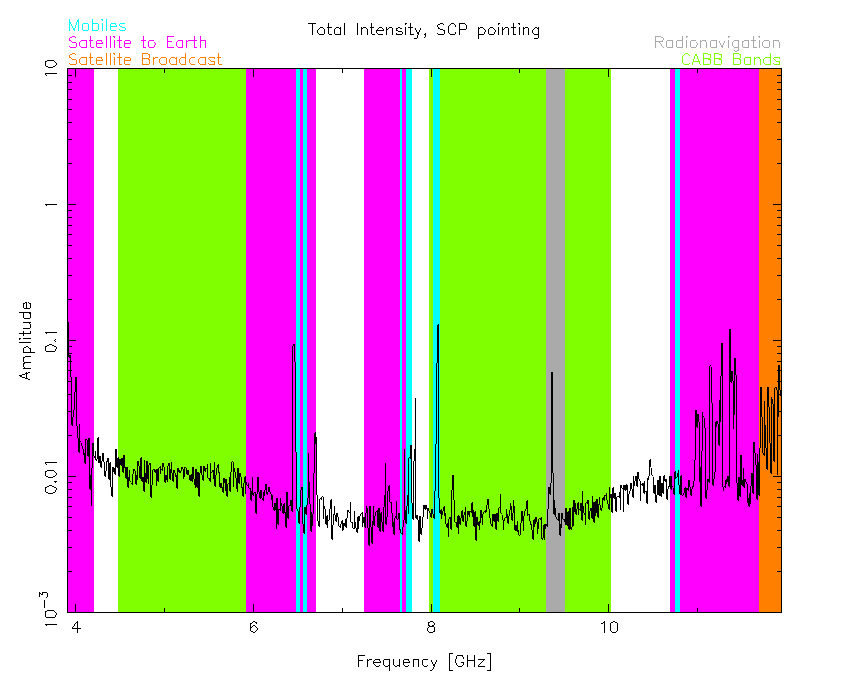
Figure 1.9. The 4cm band, as observed during an RFI survey from 2016-09-07, while the antennas were pointing at the South Celestial Pole (SCP). The colour bands show frequency ranges that represent either the CABB recommended continuum bands, or the ACMA licence applicable.
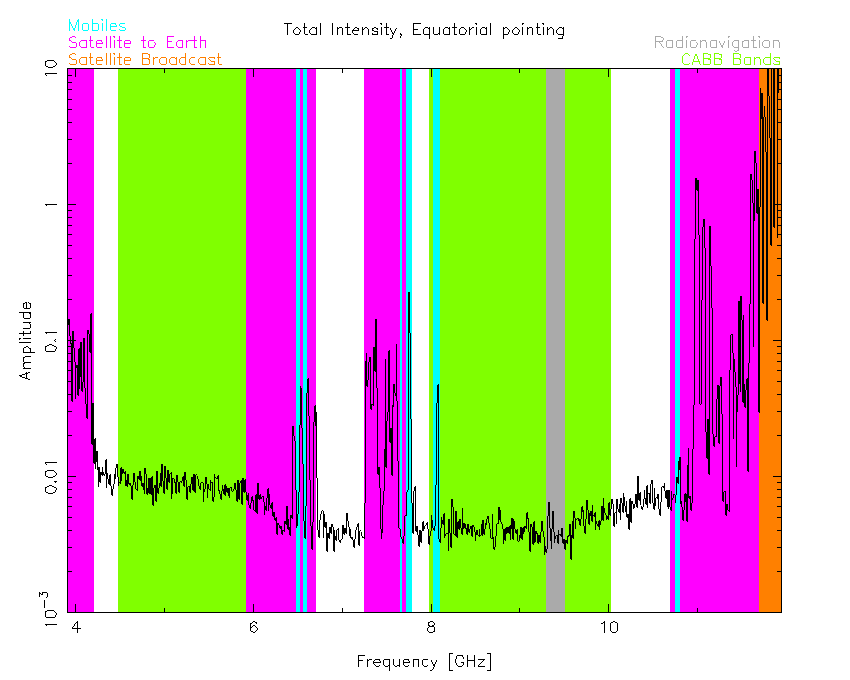
Figure 1.10. The 4cm band, as observed during an RFI survey from 2016-09-07, while the antennas were pointing at the celestial equator at transit. The colour bands show frequency ranges that represent either the CABB recommended continuum bands, or the ACMA licence applicable.
Indeed, we see that in the pink- and orange-highlighted regions of those two figures, the signal intensity is higher while pointing at the equator. That is, in the frequency bands licenced for satellite communications to Earth, the ATCA will see a lot more interfering signal while observing near to the equator. The frequencies of these highlighted regions are given in Table 1.2.
Table 1.2. Frequency ranges of satellite emission bands observed with a 4cm RFI survey. The ranges given are delimited by ACMA allocations, so several entries may be given even if they represent one contiguous frequency range.
| Purpose | Frequencies | |
|---|---|---|
| Low [GHz] | High [GHz] | |
| Communications to Earth | 3.6 | 4.2 |
| 5.925 | 6.7 | |
| 7.2525 | 7.3775 | |
| 7.375 | 7.45 | |
| 7.45 | 7.55 | |
| 7.55 | 7.75 | |
| 10.7 | 11.7 | |
| Broadcast to Earth | 11.7 | 12.2 |
The other frequency ranges shown on Figure 1.9 and Figure 1.10 encompass RFI that is not likely to be from satellites, but as can be seen, the intensity of this RFI is not high and should be easily excisable during data reduction.
There appears to be no significant interference within the 7mm and 3mm bands. An RFI survey in the 15mm band showed that interference from the Australian National Broadband Network (NBN) satellite “Sky Muster” is clearly visible when pointing toward the equator. Similar to the 4cm RFI survey technique, Figure 1.11, Figure 1.12 and Figure 1.13 show that the signal received by the antennas from this satellite (soon to be two satellites) is very dependent on the pointing direction.
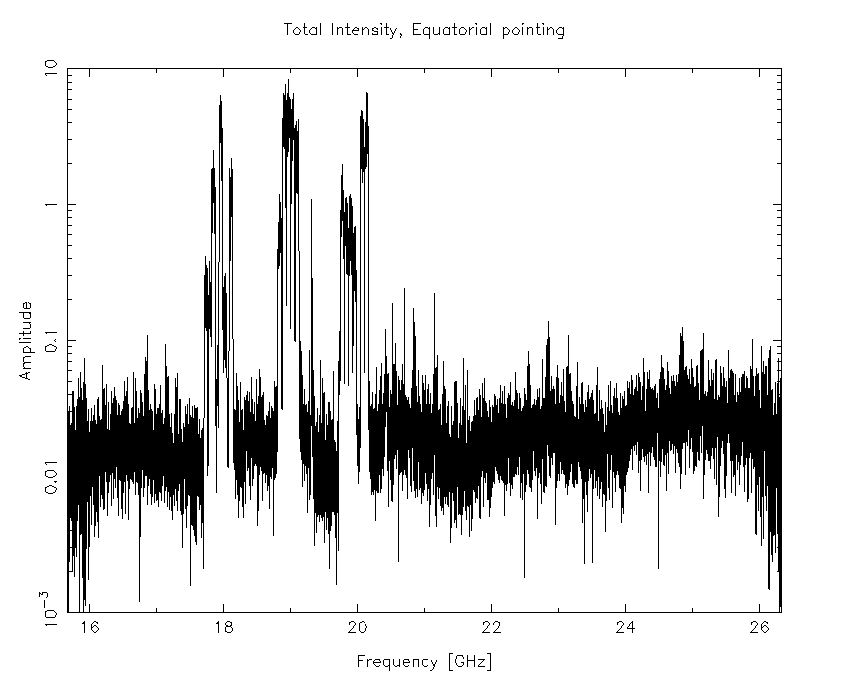
Figure 1.11. The 15mm band, as observed during an RFI survey from 2016-08-01, while the antennas were pointing at the celestial equator at transit.
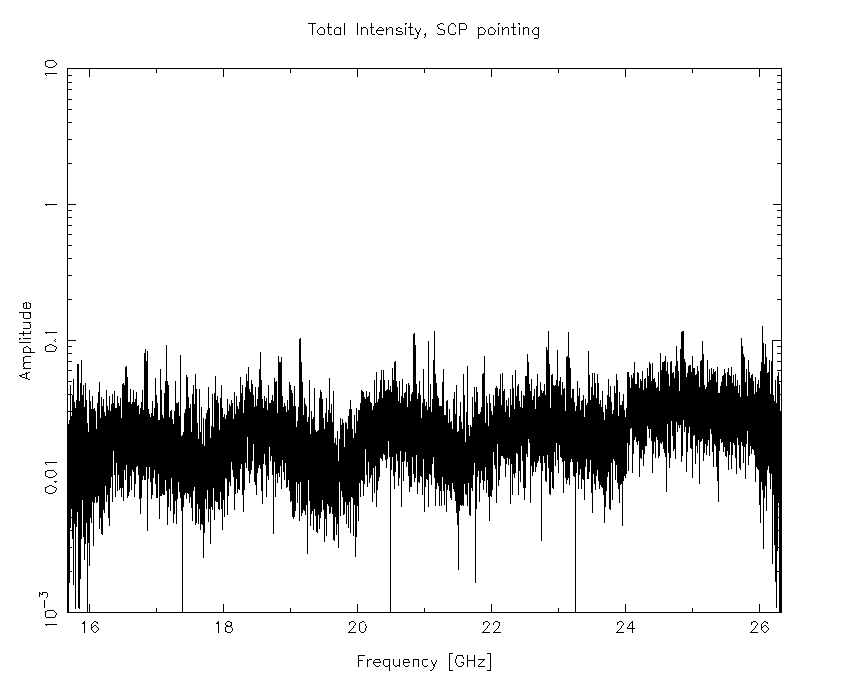
Figure 1.12. The 15mm band, as observed during an RFI survey from 2016-08-01, while the antennas were pointing at the South Celestial Pole (SCP) at transit.
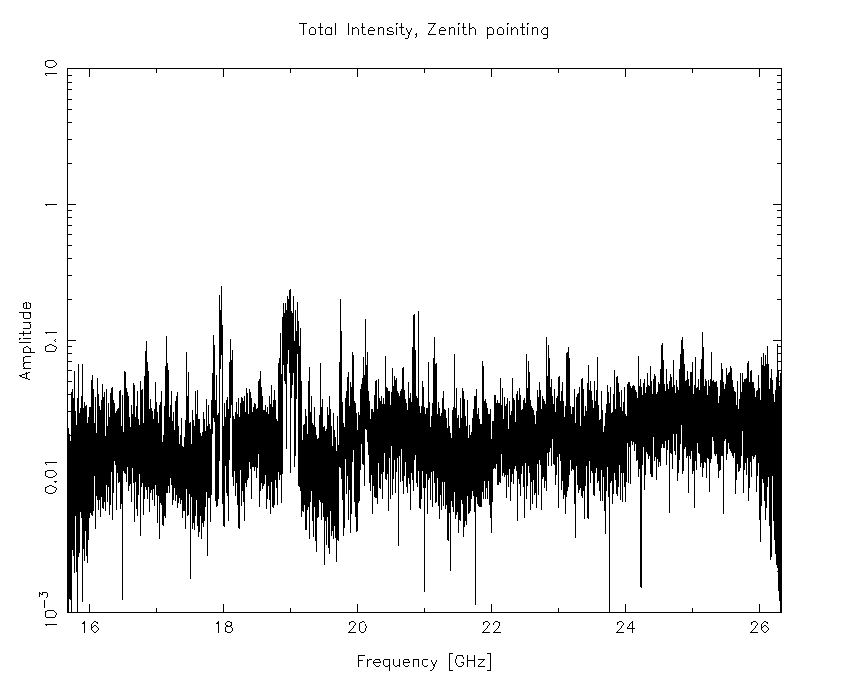
Figure 1.13. The 15mm band, as observed during an RFI survey from 2016-08-01, while the antennas were pointing east at an elevation of 85°.
The “Sky Muster” satellite emits in three broad downlink frequency ranges. These ranges are 17.7 - 18.2 GHz (Figure 1.14), 18.8 - 19.3 GHz (Figure 1.15) and 19.7 - 20.2 GHz (Figure 1.16).
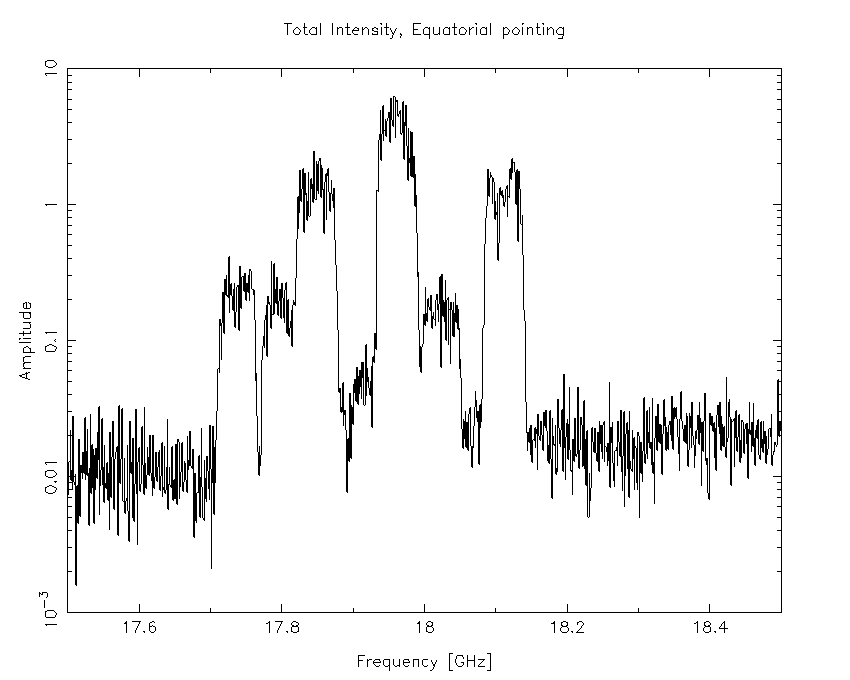
Figure 1.14. A subset of the 15mm band, as observed during an RFI survey from 2016-08-01, while the antennas were pointing at the celestial equator. This frequency subset covers the “Sky Muster” downlink range 17.7 - 18.2 GHz.
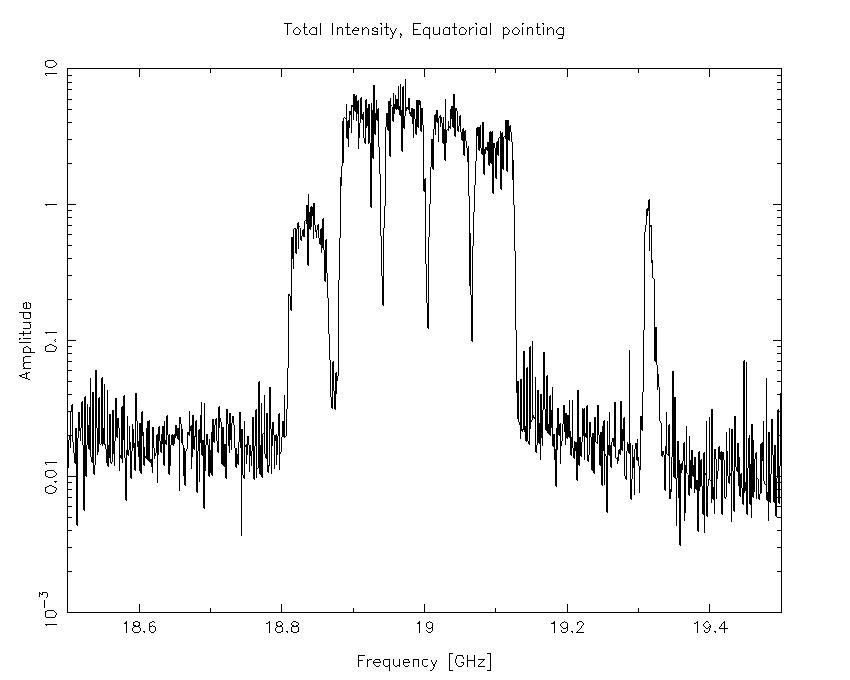
Figure 1.15. A subset of the 15mm band, as observed during an RFI survey from 2016-08-01, while the antennas were pointing at the celestial equator. This frequency subset covers the “Sky Muster” downlink range 18.8 - 19.3 GHz.
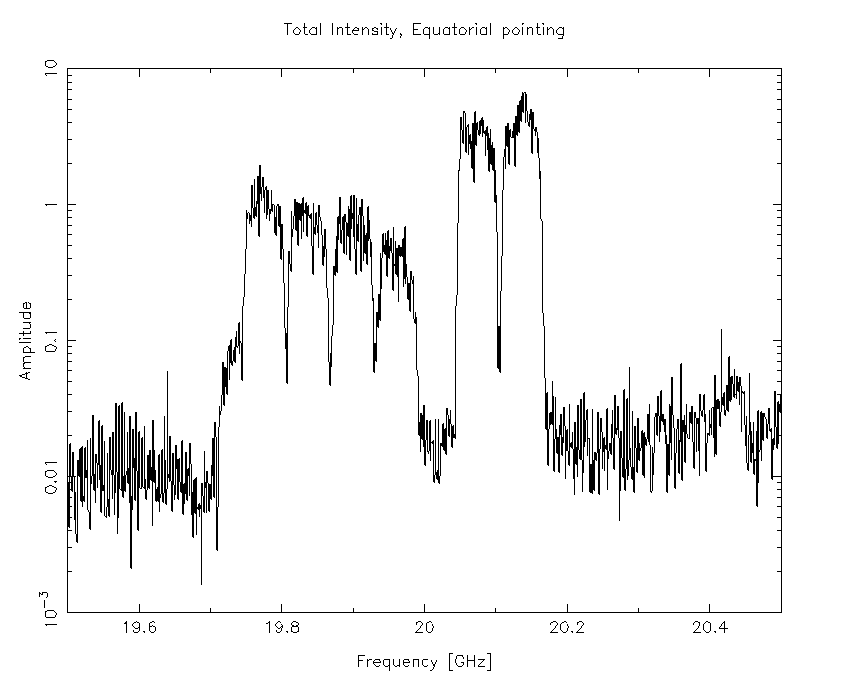
Figure 1.16. A subset of the 15mm band, as observed during an RFI survey from 2016-08-01, while the antennas were pointing at the celestial equator. This frequency subset covers the “Sky Muster” downlink range 19.7 - 20.2 GHz.
This geostationary satellite is at an azimuth of 341.5° and elevation of 53.1°, as seen from the ATCA. This corresponds to a declination of +6° 35′ and hour angle of +1h 14m (west of transit). This position is approximately 18.9° away from pointing position of the antennas during the RFI survey, so the intensity of the interference can be expected to be much higher than shown in Figure 1.11 for pointings closer to the satellite.
The recommended CABB continuum central frequencies for the 15mm band were 17 and 19 GHz, but these may now contain a significant amount of RFI from “Sky Muster”, depending on where your source is. If you are worried about this interference and wish to avoid it, we recommend a new set of continuum central frequencies of 16.7 and 21.2 GHz. These recommended frequency bands are not contiguous, but do avoid all the “Sky Muster” downlink emissions and in fact are slightly more (between 3 and 10%) sensitive than the 17/19 GHz bands in good dry weather where the atmospheric water content is low. If you need to use the 17/19 GHz bands now in order to facilitate comparisons to data obtained in the past, you will likely need to do extensive flagging during data reduction; the reduced bandwidth lost to flagging will also mean that your continuum sensitivity suffers.
To avoid Solar interference, a rule-of-thumb is to observe at a time of year when your source is further than about 40° from the Sun, where possible. It is recommended to specify in your proposal dates that are not suitable for observations if the Sun angle is too small. Low-frequency observations, particularly in spectral-line mode, should be made at greater Solar separations. You are advised to observe at night in cases where good quality 21cm HI data is essential on the shortest (30m) baseline. For spectral-line observations, software exists in Miriad to model and subtract out solar interference. Some information about solar activity can be obtained from the Bureau of Meteorology Space Weather Services.